Pre-processing Module – Usage Example
This notebook provides an example of how to apply the functions included in the
pre_processing module to an artificial dataset.You can generate this dataset by running the
generate_data.py script located in the /data directory.A detailed description of the artificial dataset can be found in the test_data page.
The following code blocks make direct use of the functions from the
pre_processing module, with the exception of despiking_VM97().In that case, the function has been unpacked to reveal the effect of each iteration on the time series, allowing for a clearer understanding of its internal mechanism.
[10]:
# import libraries
import numpy as np
import pandas as pd
import matplotlib.pyplot as plt
import core as core
import pre_processing as pre_processing
[2]:
# data import
# before running this code, make sure to execute the script `generate_data.py` located in the `/data` folder.
# a description of the artificial dataset is at ""
# it will generate the file test_data.csv
rawdata = core.import_data("../../../data/test_data.csv")
rawdata
[2]:
| u | v | w | T_s | |
|---|---|---|---|---|
| Time | ||||
| 2012-09-28 02:00:00.000 | 1.333983 | 1.950923 | -1.315317 | 21.345880 |
| 2012-09-28 02:00:00.050 | 3.913318 | 3.113077 | 0.963788 | 20.241874 |
| 2012-09-28 02:00:00.100 | 2.968685 | 2.469642 | -1.189558 | 19.199482 |
| 2012-09-28 02:00:00.150 | 1.802636 | 2.895592 | 0.841644 | 19.297309 |
| 2012-09-28 02:00:00.200 | 2.039941 | 2.993014 | -0.849563 | 20.799291 |
| ... | ... | ... | ... | ... |
| 2012-09-28 02:59:59.800 | 2.306694 | 2.139521 | 0.166791 | 21.853908 |
| 2012-09-28 02:59:59.850 | 1.747777 | 2.585360 | 0.969503 | 20.976037 |
| 2012-09-28 02:59:59.900 | 2.334571 | 0.978542 | 0.615828 | 20.735504 |
| 2012-09-28 02:59:59.950 | 2.406629 | 2.581448 | -0.812357 | 19.292241 |
| 2012-09-28 03:00:00.000 | 1.229078 | 2.900965 | -1.132447 | 20.432471 |
71800 rows × 4 columns
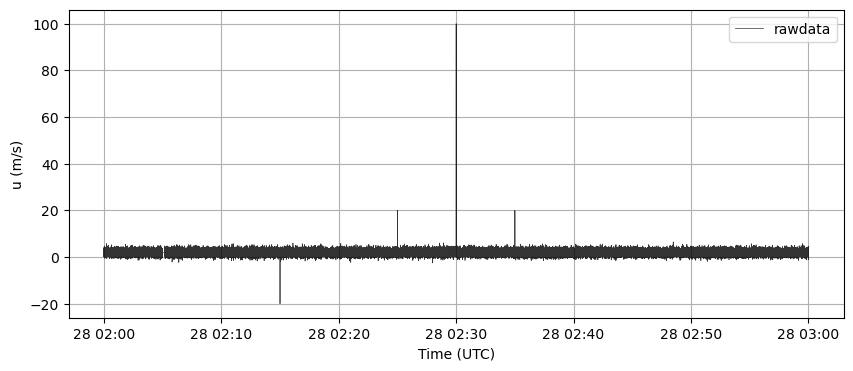
[3]:
plt.figure(figsize=(10, 4))
plt.plot(rawdata.index, rawdata["u"], label='rawdata', color='k', alpha=0.8, lw=0.5)
plt.grid(True)
plt.legend()
plt.ylabel("u (m/s)")
plt.xlabel("Time (UTC)")
plt.show()
[4]:
# fill missing timestamps
data_complete = pre_processing.fill_missing_timestamps(rawdata, freq=20)
time = data_complete.index
[5]:
print(f"Points in the rawdata: {len(rawdata)}")
print(f"Points after filling timestamps procedure: {len(data_complete)}")
Points in the rawdata: 71800
Points after filling timestamps procedure: 72001
[6]:
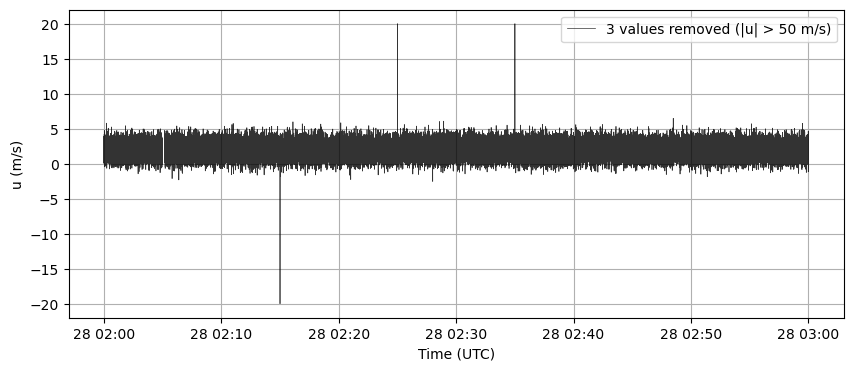
# remove values beyond threshold
threshold = 50
u_clean, count_beyond = pre_processing.remove_beyond_threshold(data_complete["u"].to_numpy(),
                                                               threshold)
[7]:
plt.figure(figsize=(10, 4))
plt.plot(time, u_clean, label=f'{count_beyond} values removed (|u| > {threshold} m/s)', color='k', alpha=0.8, lw=0.5)
plt.grid(True)
plt.legend()
plt.ylabel("u (m/s)")
plt.xlabel("Time (UTC)")
plt.show()
[ ]:
# defining despiking parameters
window_length = core.min_to_points(minutes = 5, sampling_freq = 20)
c = 3.5
max_consecutive_spikes = 3
max_iterations = 10
[16]:
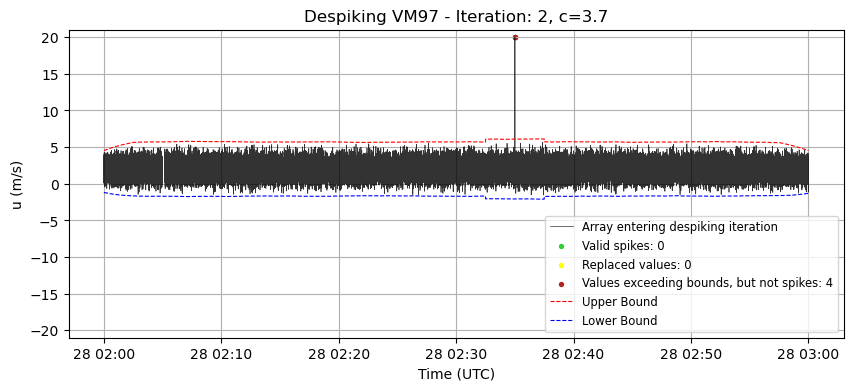
# despiking VM97

# --- Despiking process ---
array_to_despike = u_clean
iteration = 0  # Counter for the number of iterations in the despiking process
c_increment = 0.1  # Increment value for adjusting the bounds in each iteration
current_c = c  # Initial multiplier for the standard deviation (controls the bounds)
array_despiked = array_to_despike.copy()  # Copy of the original array to be despiked
count_spike = 1  # Initial value greater than 0 to start the despiking cycle

# The loop continues until no more spikes are detected or the maximum number of iterations is reached
while count_spike != 0 and iteration <= max_iterations:
    # Calculate the running mean and standard deviation for the current array
    running_mean, running_std = core.running_stats(array_despiked, window_length)

    # Define the upper and lower bounds based on the running statistics and current multiplier (current_c)
    upper_bound = running_mean + current_c * running_std
    lower_bound = running_mean - current_c * running_std


    # ------------------------------------------ #
    # Save the array before the action og identify_interp_spikes()
    array_before = array_despiked.copy()
    # ------------------------------------------ #


    # Create a mask to detect values beyond the defined bounds
    beyond_bounds_mask = (array_despiked > upper_bound) | (array_despiked < lower_bound)

    # Identify and interpolate values that are beyond the bounds and respect max_length criterion (spikes)
    array_despiked, count_spike = pre_processing.identify_interp_spikes(array_despiked, beyond_bounds_mask, max_consecutive_spikes)

    # ------------------------------------------ #
    # Create a mask to detect modified values
    nan_mask = np.isnan(array_before) & np.isnan(array_despiked)
    diff_mask = np.not_equal(array_before, array_despiked)
    modified_mask = diff_mask & ~nan_mask

    # Create a mask to detect long sequences not modified
    too_long_mask = beyond_bounds_mask & (~modified_mask)

    # Plot
    plt.figure(figsize=(10, 4))
    plt.plot(time, array_before, label='Array entering despiking iteration', color='k', alpha=0.8, lw=0.5)
    plt.scatter(time[modified_mask], array_before[modified_mask],
                label=f'Valid spikes: {count_spike}', color='limegreen', s=8, zorder=2)
    plt.scatter(time[modified_mask], array_despiked[modified_mask],
                label=f'Replaced values: {np.sum(modified_mask)}', color="yellow", s=8, zorder=2)
    plt.scatter(time[too_long_mask], array_before[too_long_mask],
                label=f'Values exceeding bounds, but not spikes: {np.sum(too_long_mask)}', color="firebrick", s=8)
    plt.plot(time, upper_bound,
             label='Upper Bound', color='red', linestyle='--', lw=0.8)
    plt.plot(time, lower_bound,
             label='Lower Bound', color='blue', linestyle='--', lw=0.8)
    plt.title(f'Despiking VM97 - Iteration: {iteration}, c={current_c}')
    plt.xlabel('Time (UTC)')
    plt.ylabel('u (m/s)')
    plt.ylim(-21,21)
    plt.legend(fontsize='small', loc='lower right')
    plt.grid(True)
    plt.show()
    # ------------------------------------------ #

    # Increase the multiplier for the next iteration to make the bounds wider
    current_c += c_increment
    iteration += 1  # Increment the iteration counter
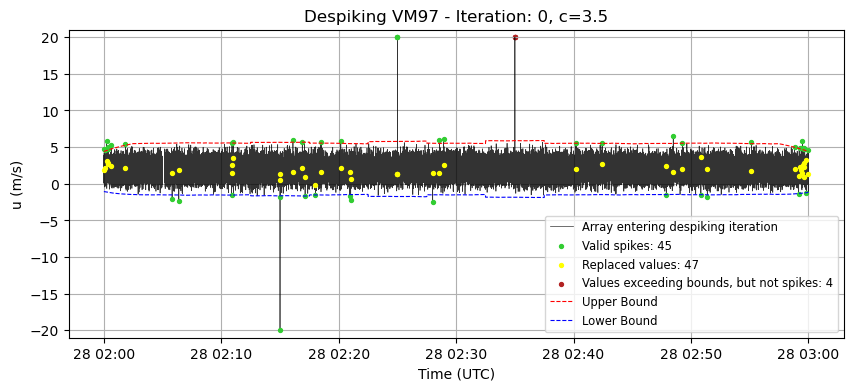
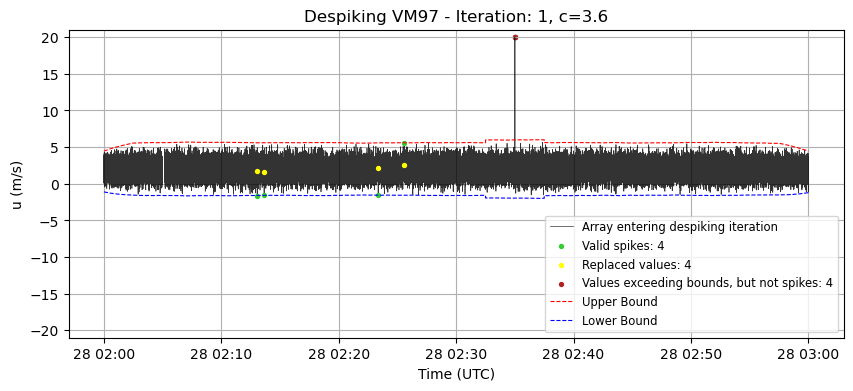
[17]:
nan_mask_final = np.isnan(array_to_despike) & np.isnan(array_despiked)
diff_mask_final = np.not_equal(array_to_despike, array_despiked)
modified_mask_final = diff_mask_final & ~nan_mask_final
print(f"Changed values in the Despiking VM97 procedure: {np.sum(modified_mask_final)}")
Changed values in the Despiking VM97 procedure: 51
[13]:
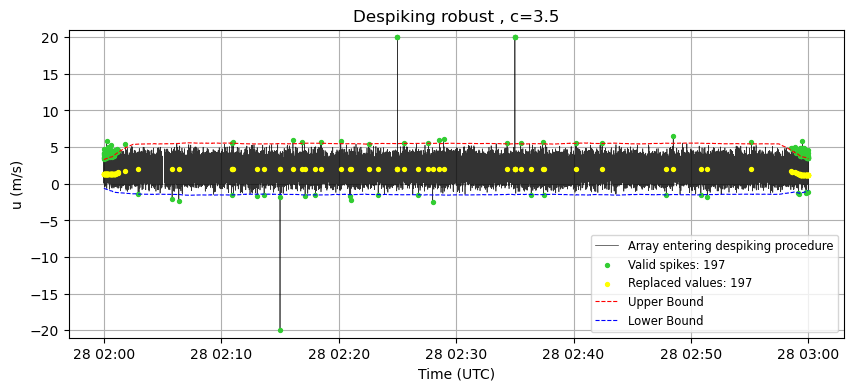
# despiking robust
array_despiked = u_clean.copy()

# Calculate the running median and robust standard deviation for the array
running_median, running_std_robust = core.running_stats_robust(array_despiked, window_length)

# Compute the delta (threshold for spike detection) as the maximum between c times the robust standard deviation and 0.5
delta = np.maximum(c * running_std_robust, 0.5)

# Define the upper and lower bounds based on the running median and the computed delta
upper_bound = running_median + delta
lower_bound = running_median - delta

# Create a mask to detect values that lie outside the defined bounds (spikes)
beyond_bounds_mask = (array_despiked > upper_bound) | (array_despiked < lower_bound)

# Count the number of spikes (values that are beyond the bounds)
count_spike = np.sum(beyond_bounds_mask)

# Replace the values that are outside the bounds with the corresponding values from the running median
array_despiked[beyond_bounds_mask] = running_median[beyond_bounds_mask]

u_despiked_robust = array_despiked.copy()
count_spike_robust = count_spike
[14]:
# Plot
nan_mask_robust = np.isnan(u_clean) & np.isnan(u_despiked_robust)
diff_mask_robust = np.not_equal(u_clean, u_despiked_robust)
modified_mask_robust = diff_mask_robust & ~nan_mask_robust

plt.figure(figsize=(10, 4))
plt.plot(time, u_clean, label='Array entering despiking procedure', color='k', alpha=0.8, lw=0.5)
plt.scatter(time[modified_mask_robust], u_clean[modified_mask_robust],
            label=f'Valid spikes: {count_spike_robust}', color='limegreen', s=8, zorder=2)
plt.scatter(time[modified_mask_robust], u_despiked_robust[modified_mask_robust],
            label=f'Replaced values: {np.sum(modified_mask_robust)}', color="yellow", s=8, zorder=2)
plt.plot(time, upper_bound,
            label='Upper Bound', color='red', linestyle='--', lw=0.8)
plt.plot(time, lower_bound,
            label='Lower Bound', color='blue', linestyle='--', lw=0.8)
plt.title(f'Despiking robust , c={c}')
plt.xlabel('Time (UTC)')
plt.ylabel('u (m/s)')
plt.ylim(-21,21)
plt.legend(fontsize='small', loc='lower right')
plt.grid(True)
plt.show()
[18]:
print(f"Changed values in the 'robust' procedure: {np.sum(modified_mask_robust)}")
Changed values in the 'robust' procedure: 197
[19]:
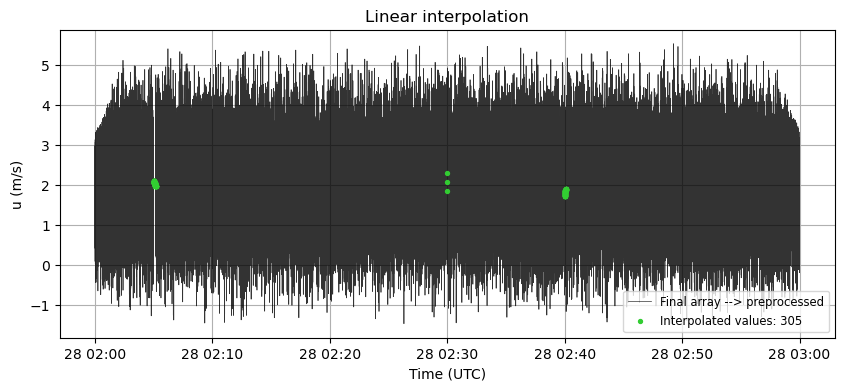
u_continuous, count_interp = pre_processing.interp_nan(u_despiked_robust)
[21]:
interp_changes = np.not_equal(u_despiked_robust, u_continuous)
plt.figure(figsize=(10, 4))
plt.plot(time, u_continuous, label='Final array --> preprocessed', color='k', alpha=0.8, lw=0.5)
plt.scatter(time[interp_changes], u_continuous[interp_changes],
            label=f'Interpolated values: {count_interp}', color='limegreen', s=8, zorder=2)
plt.title(f'Linear interpolation')
plt.xlabel('Time (UTC)')
plt.ylabel('u (m/s)')
# plt.ylim(-21,21)
plt.legend(fontsize='small', loc='lower right')
plt.grid(True)
plt.show()
[23]:
print(f"Interpolated values: {count_interp}")
Interpolated values: 305